Projects
Welcome to my data science portfolio 👋! Here you’ll find selected projects that showcase my developing skills in data cleaning, exploratory data analysis, visualization, and predictive modeling. As a student learning data science, I focus on building end-to-end analytical workflows in Python and Java, and I am also learning other programming languages to broaden my programming skills. I apply statistical methods and machine learning techniques while practicing clear, reproducible analysis.
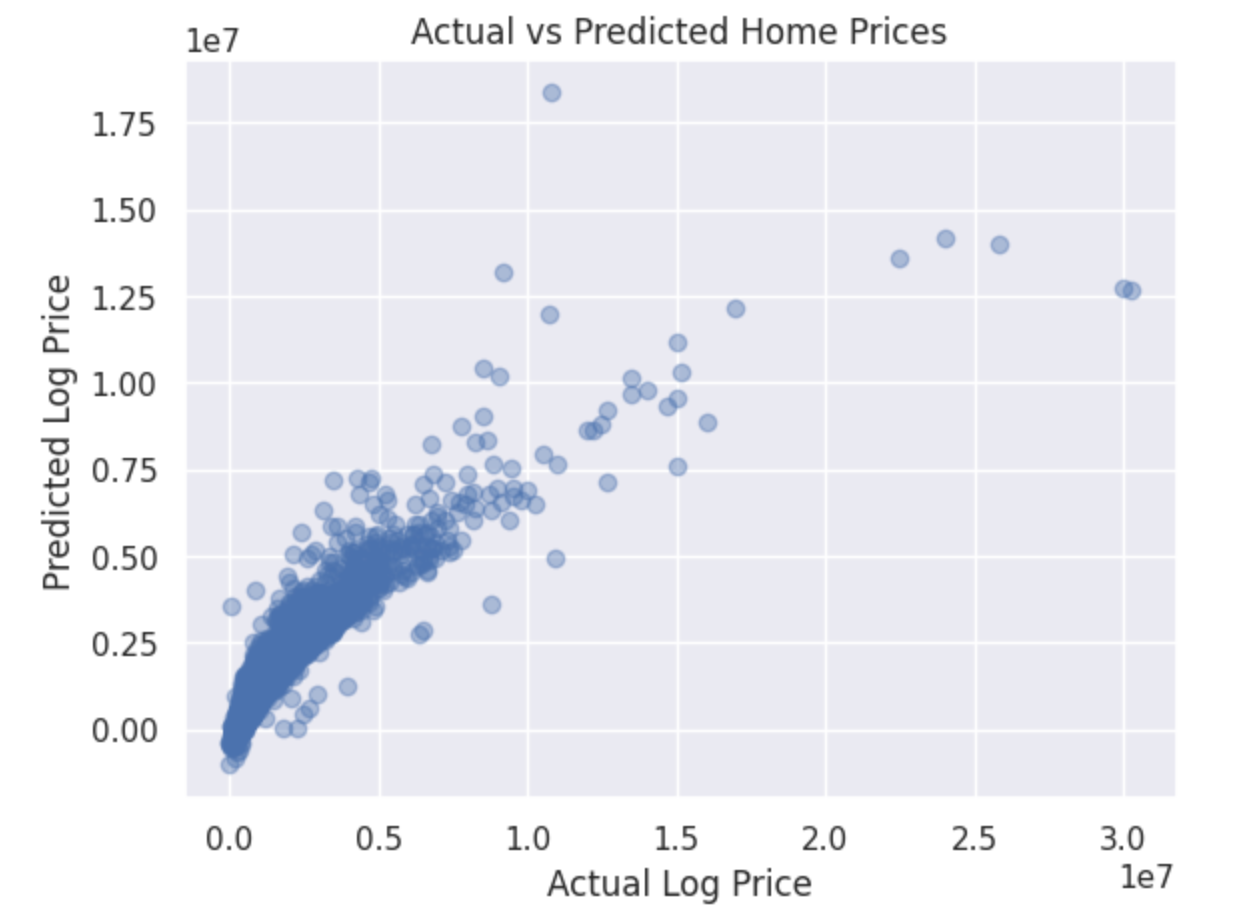
California Real Estate Market Analysis
A data analysis and visualization project focused on exploring California’s residential real estate market trends and pricing patterns, emphasizing clear data storytelling.
Background & Motivation
The California housing market has long been one of the most dynamic and complex in the U.S., with prices influenced by supply shortages, demand growth, and regional disparities. This analysis aims to uncover trends in pricing, inventory, and key property features.
Data & Methods
- Data cleaning and feature engineering to refine the dataset
- Exploratory data analysis using Pandas and Seaborn
- Visualized price distributions and relationships with key variables
- Compared multiple regression and ensemble methods for predictive insights
Key Insights
- Location, living area, and property amenities significantly influence pricing
- Ensemble models such as Gradient Boosting and XGBoost performed best in prediction
- Log transformation improved model stability and interpretability
Tools & Skills: Python, Pandas, NumPy, Matplotlib, Seaborn, Scikit-Learn, Data Visualization
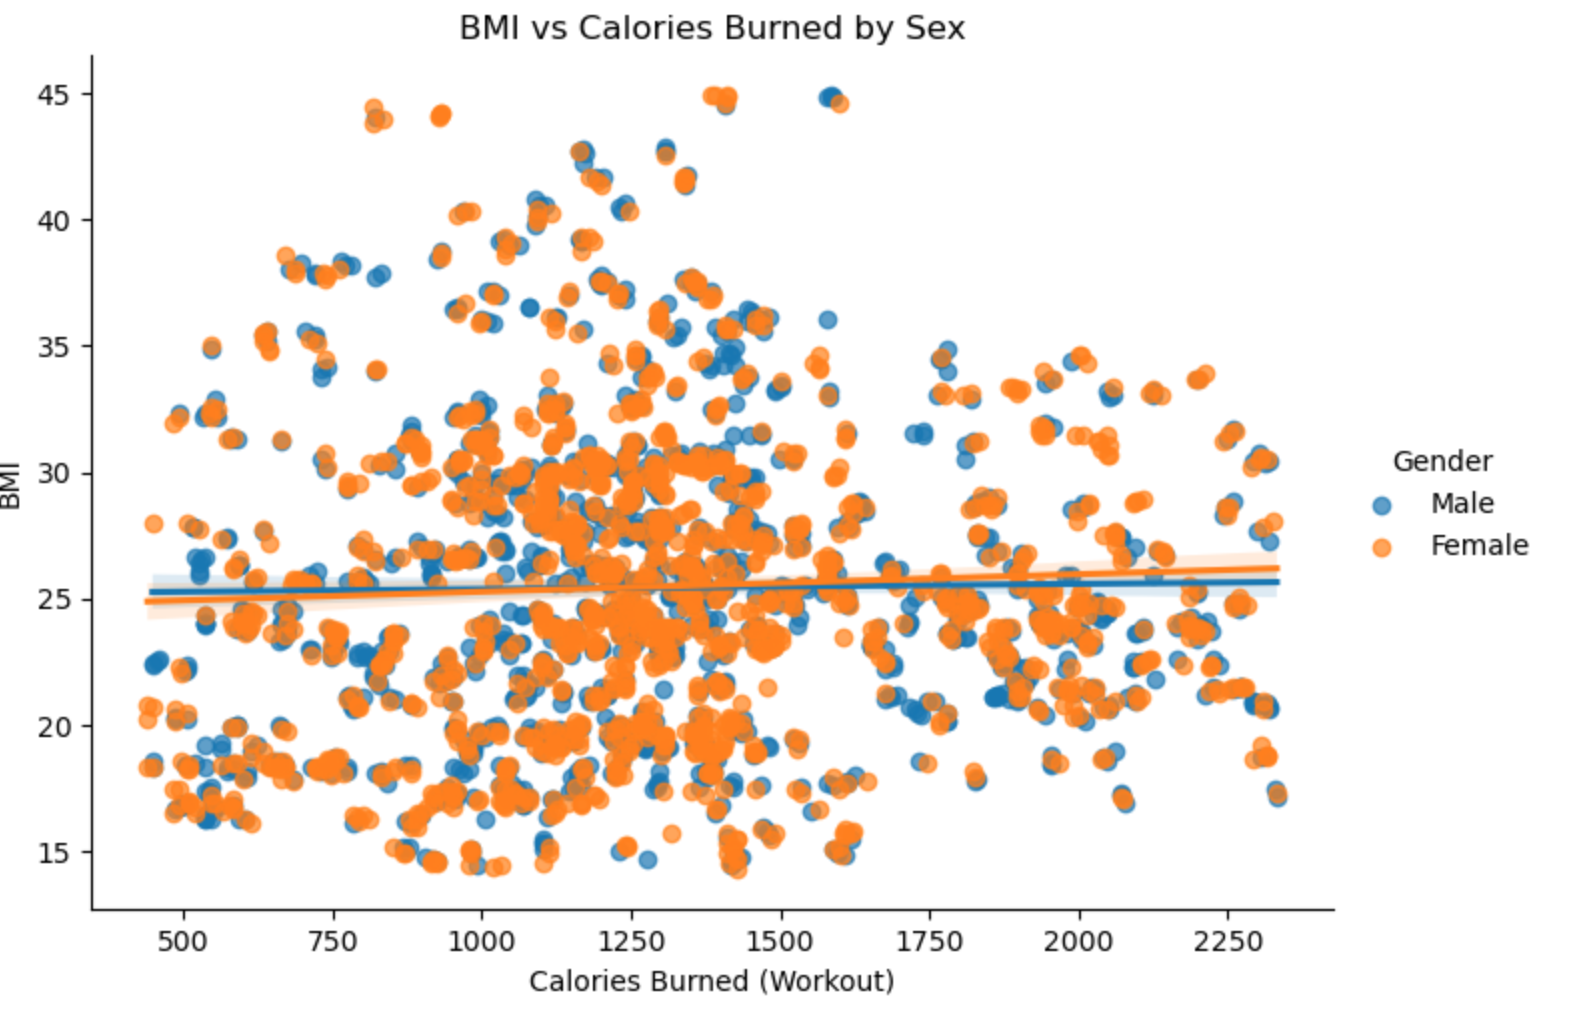
Sex Differences in Obesity Predictors
A health data analysis project examining how biological sex relates to BMI, calorie expenditure, and other physiological indicators through statistical analysis and visualization.
Background & Motivation
Obesity is a major public health concern worldwide, but risk factors and body composition patterns often differ between males and females. This project investigates these differences to better understand how biological and behavioral factors contribute to obesity-related trends.
Data & Methods
- Cleaned and preprocessed health and activity datasets
- Performed exploratory data analysis using Pandas and Seaborn
- Compared BMI, calorie burn, and activity metrics by sex
- Built interactive visualizations using Plotly for deeper exploration
Key Insights
- Clear differences observed in calorie expenditure patterns between sexes
- BMI distributions varied significantly across demographic groups
- Visualization revealed nonlinear relationships between activity and BMI
Tools & Skills: Python, Pandas, Seaborn, Plotly, Data Visualization, Exploratory Data Analysis
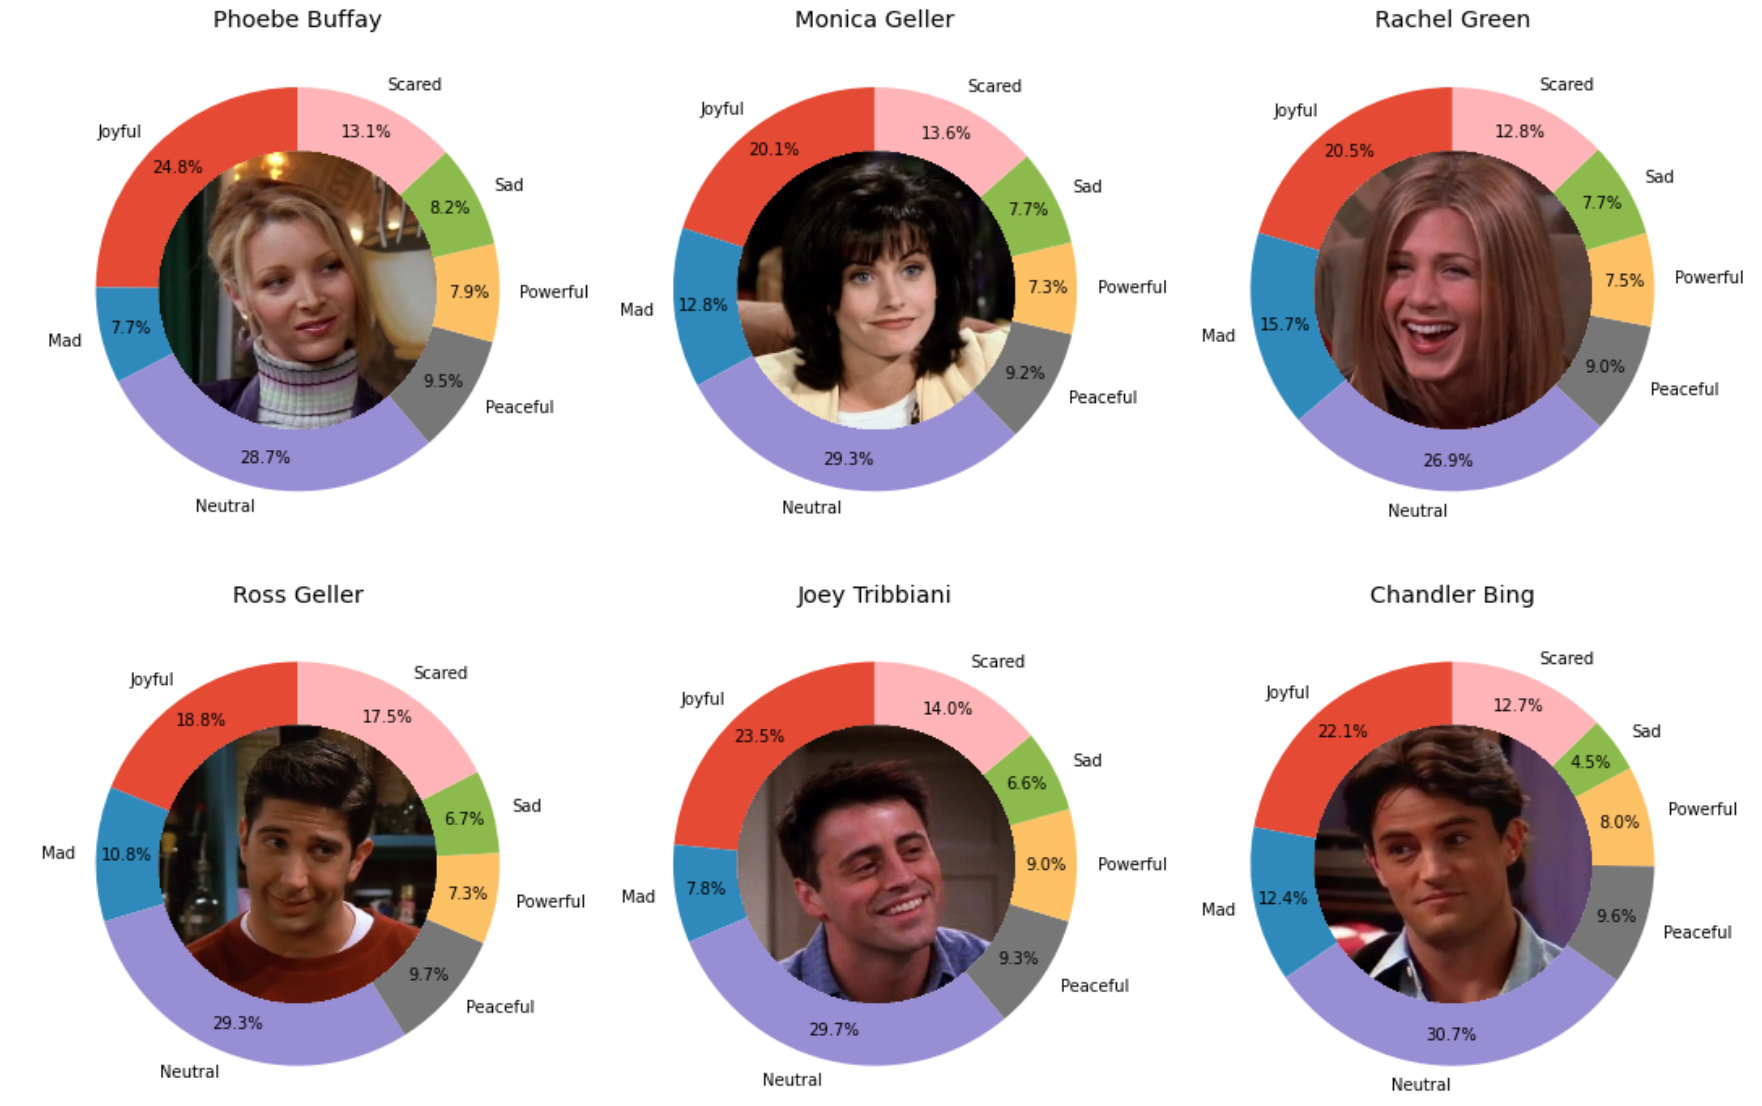
Friends TV Show Dialogue & Sentiment Analysis
A text and sentiment analysis project exploring emotional trends, narrative structure, and character representation in the TV series Friends.
Background & Motivation
Television narratives reflect social dynamics and character development over time. This project analyzes dialogue data from Friends to understand emotional arcs, screen presence, and gender representation using data-driven storytelling.
Data & Methods
- Processed and structured dialogue transcripts for analysis
- Performed sentiment analysis to track emotional changes across episodes
- Analyzed character dialogue frequency and narrative prominence
- Visualized trends using Pandas and Seaborn
Key Insights
- Emotional intensity peaks aligned with major narrative turning points
- Dialogue distribution highlighted shifts in character focus across seasons
- Data revealed subtle gender representation patterns in speaking time
Tools & Skills: Python, Pandas, Seaborn, NLP, Sentiment Analysis, Data Visualization